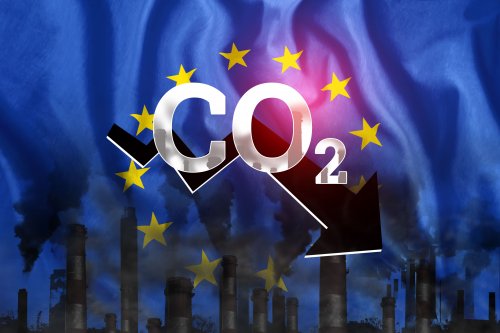
The EU has developed a transparent methodology for disaggregating emissions and assessing the intensity of emissions of specific production routes and process stages.
This is stated in the new report of the European Commission "Intensity of greenhouse gases of the EU steel industry and its trading partners", reports European Commission.
The report assessed the greenhouse gas intensity figures for the steel industry of the EU and its 16 main global trading partners, which account for over 90% of steel imports to the EU.
The proposed methodology can also be replicated in other geographical and temporal scales and creates a basis for estimating greenhouse gas intensity in other energy-intensive industries. Researchers used a top-down approach and relied on public databases.
The results showed that using a bottom-up approach, starting with aggregated statistics, the total greenhouse gas emissions per ton of steel can be estimated with a low margin of error. In the further allocation of emissions to industry-specific production routes and process stages, the accuracy of the results depends on the availability of data on the intensity of energy products at intermediate stages of the process.
The developed methodology makes it possible to distinguish scope 1 and scope 2 emissions, and also indicates the importance of accounting for the net import of intermediate products when estimating the intensity of greenhouse gas emissions, taking into account the world trade in intermediate products in the metallurgical sector.
"The proposed bottom-up approach allows estimating the total greenhouse gas intensity with a relatively low margin of error for ferrous metallurgy. However, emission intensities on routes and stages may decrease with each step of disaggregation. "Following the proposed top-down methodology, we can compare the carbon intensity of cast iron and steel at production routes and stages of the process in the EU and its 16 main global trading partners," the report says.
The study found that the EU and China report the lowest emissions intensity, while India and South Africa are at the higher end of the spectrum. These two countries also show high carbon intensity, which is mainly driven by high Scope 2 emissions.
This can be explained by the use of primary energy resources and the efficiency of factories.
The data obtained during the study have small absolute differences with the ETS reference values.
The report noted that this information is directly relevant to the carbon risk knowledge framework in the wider context of the European Green Deal and can be used to support the implementation of a 'default value' under CBAM.
We will remind EUROFER explained how the next steps on ETS and CBAM will affect the green steel.
As EcoPolitic reported previously, India's JSW Steel plans reduce CO2 emissions by 42% until 2030.


