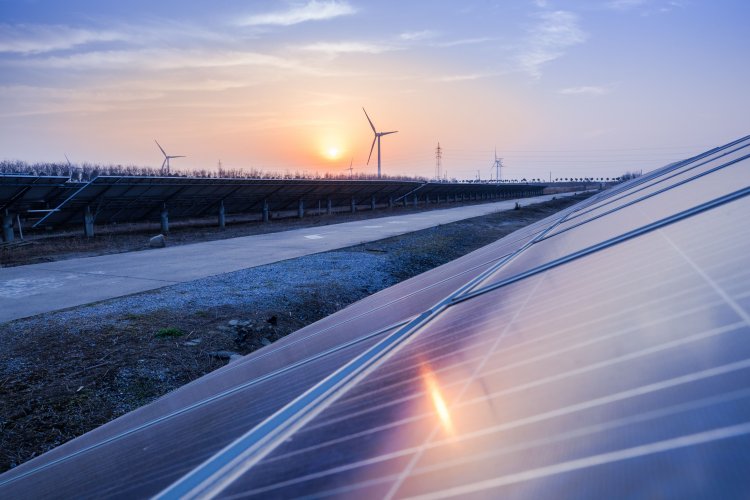
Throughout 2025, renewable energy sources in the EU accounted for 47.3% of energy consumption. Compared to the previous year, 2024, the share of "green" energy increased by 0.1 percentage points from 47.2%.
This is according to the latest data from Eurostat.
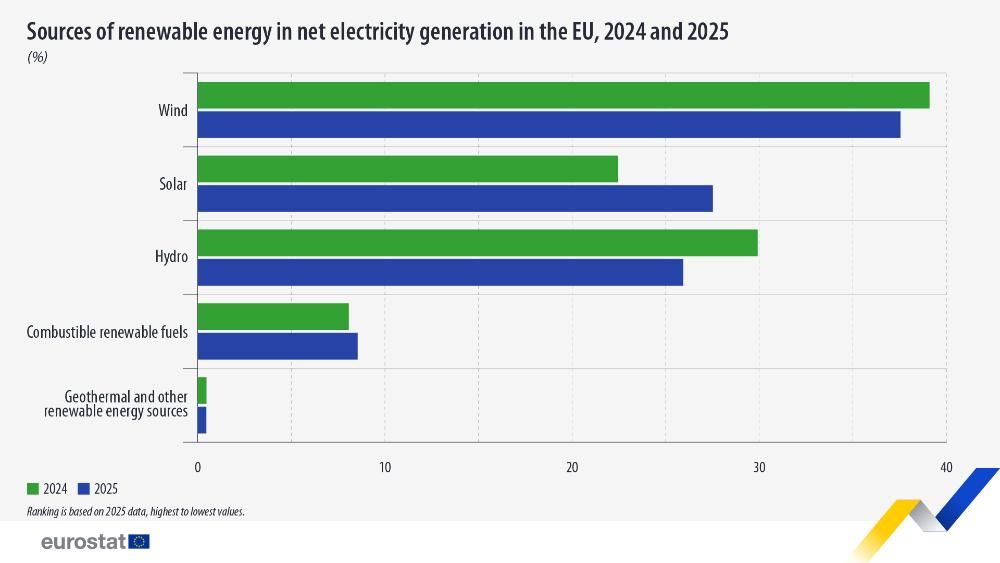
Which source provided the most energy?
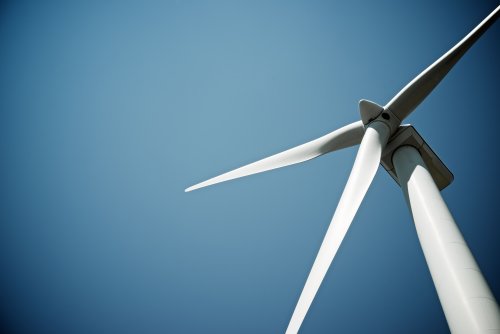
Wind power plants generated the most electricity for the European Union. Overall, wind accounted for 37.5% of all clean energy for the year.
The solar segment provided 27.5% of generation, and hydropower – 25.9%. Thanks to renewable fuels, the EU received an additional 8.5% of green energy.
Solar energy showed the largest annual increase—in 2025, it generated 24.6% more energy than in 2024. Hydropower showed the largest decline, with its share of renewable energy decreasing by 11.8%.
Source: Eurostat
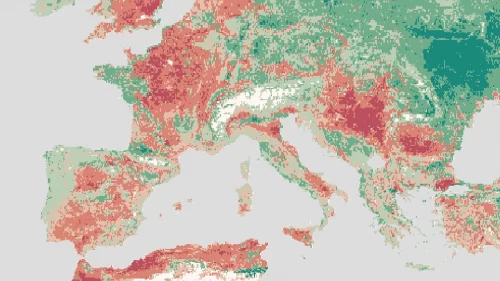
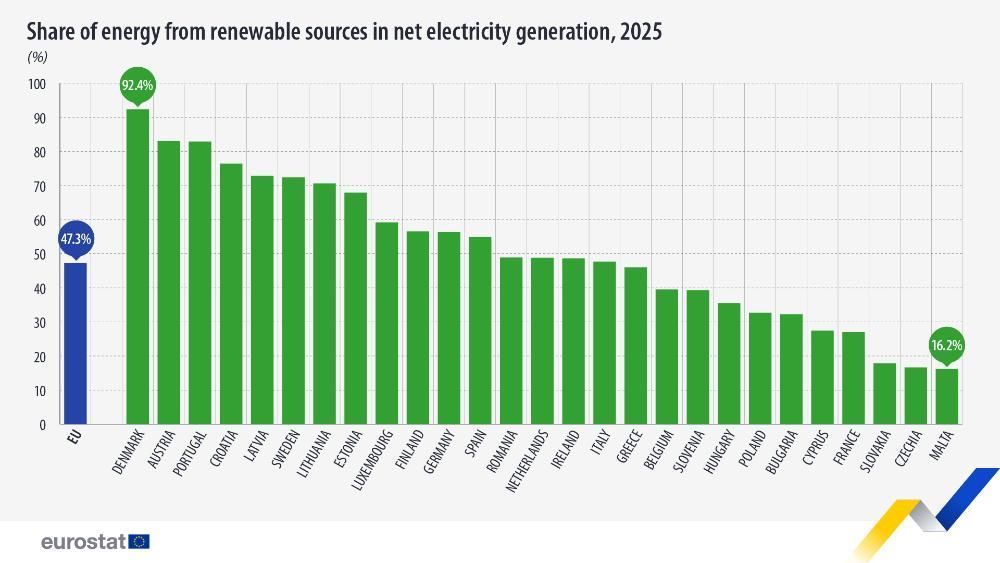
Leaders and laggards among EU countries
According to Eurostat, the top three countries by share of “green” energy in total consumption were:
- Denmark – 92.4%. Here, the largest share was from wind power.
- Austria – 83.1%. In the “green” segment, hydropower prevailed.
- Portugal – 82.9%. Most of this country’s clean energy was generated by water and wind.
The three countries with the lowest share of renewables in 2025 were:
- Malta – 16.6%;
- Czechia – 16.6%;
- Slovakia – 17.8%.
Source: Eurostat
EcoPolitic previously reported that in 2025, the share of “green” energy in Ukraine amounted to 10.7%. Wind generation added 324.4 MW of capacity during the year, while solar – 1.5 GW.